

6 key indicators to measure and optimize your ecommerce
Estimated reading time:9 Min
“What is not measured, cannot be controlled; what cannot be controlled, cannot be improved.”
In the world ofecommerce, measuring is not an option: it is an obligation.
As the sentence that opens this article says,“What is not measured, cannot be controlled; and what cannot be controlled, cannot be improved.”
Each click, purchase or abandonment within your online store leaves a mark that, well interpreted, can become acompetitive advantage.
However, many digital businesses still operate blindly, without knowing the indicators that really determine their profitability and growth.
TheKPIs (Key Performance Indicators)They are the compass of any ecommerce. They allowevaluate the effectiveness of your strategies, customer satisfaction and the overall health of your business.
Knowing which ones to follow, how to calculate them and what decisions to make based on them is what differentiates a store with sustained growth from one that only survives in the digital market.
In this guide you will find the6 essential indicators that no ecommerce should stop measuring:
• Conversion rate.
• Customer acquisition cost (CAC).
• Retention and repurchase rate.
• Inventory rotation.
• Average Order Value (AOV).
• Customer Lifetime Value (LTV).
Each one will show you a key aspect of your operation: from how much it costs you to get a customer, to how much value they provide during their relationship with your brand.
Because in ecommerce,data is not just numbers, arestrategic decisionsthat determine whether your business grows, stagnates or regresses.
Knowing, measuring and optimizing your metrics will not only improve your sales, but also the efficiency of your operation, your logistics and your customers' experience.
Start measuring today:Indicators are the language of digital growth.
Have you heard about KPIs?
TheKPIsor key performance indicators, are a measurement system to evaluate certain important aspects of your business; an x-ray that allows you to demonstrate their behavior and level of progress.
What KPIs can you measure in your ecommerce?
To evaluate whether your strategies are on the right track and identify opportunities for improvement, we recommend the following:KPIs. They are not the only ones! However, they are the most relevant for theecommerce, determine and measure the most important ones for your growth record.
- Conversion rate
- Customer Acquisition Cost (CAC)
- Customer Retention Rate/Repurchase
- Inventory Turnover
- Average Order Value (AOV)
- Customer Lifetime Value (LTV)
Let's start by describing each of them and the aspects that you should consider for their measurement:
1.Conversion Rate
What are you looking for for yourself?ecommerce? Data on your potential customers (leads) to deploy marketing actions? Completed purchase transactions? ¿Descargas de catálogos u otros PDF? All of the above are conversion goals.
En este caso, debes evaluar del total de visitantes que tuviste en tu tienda, ¿Cuántos realizaron la conversión? Which, ultimately, is what interests us most for our business objectives.
The average conversion rate depends a lot on the economic sector. For the online sales channel in general, according to studies, it is between 1 and 3%, which means that, of 500 people who visit your store, between 5 and 15 will buy from you.

What ecommerce industry do you belong to?
According to analyzes carried out in 2020 by the Spanish company Flat 101, the following are the average conversion percentages inecommerce, by device and economic sector:

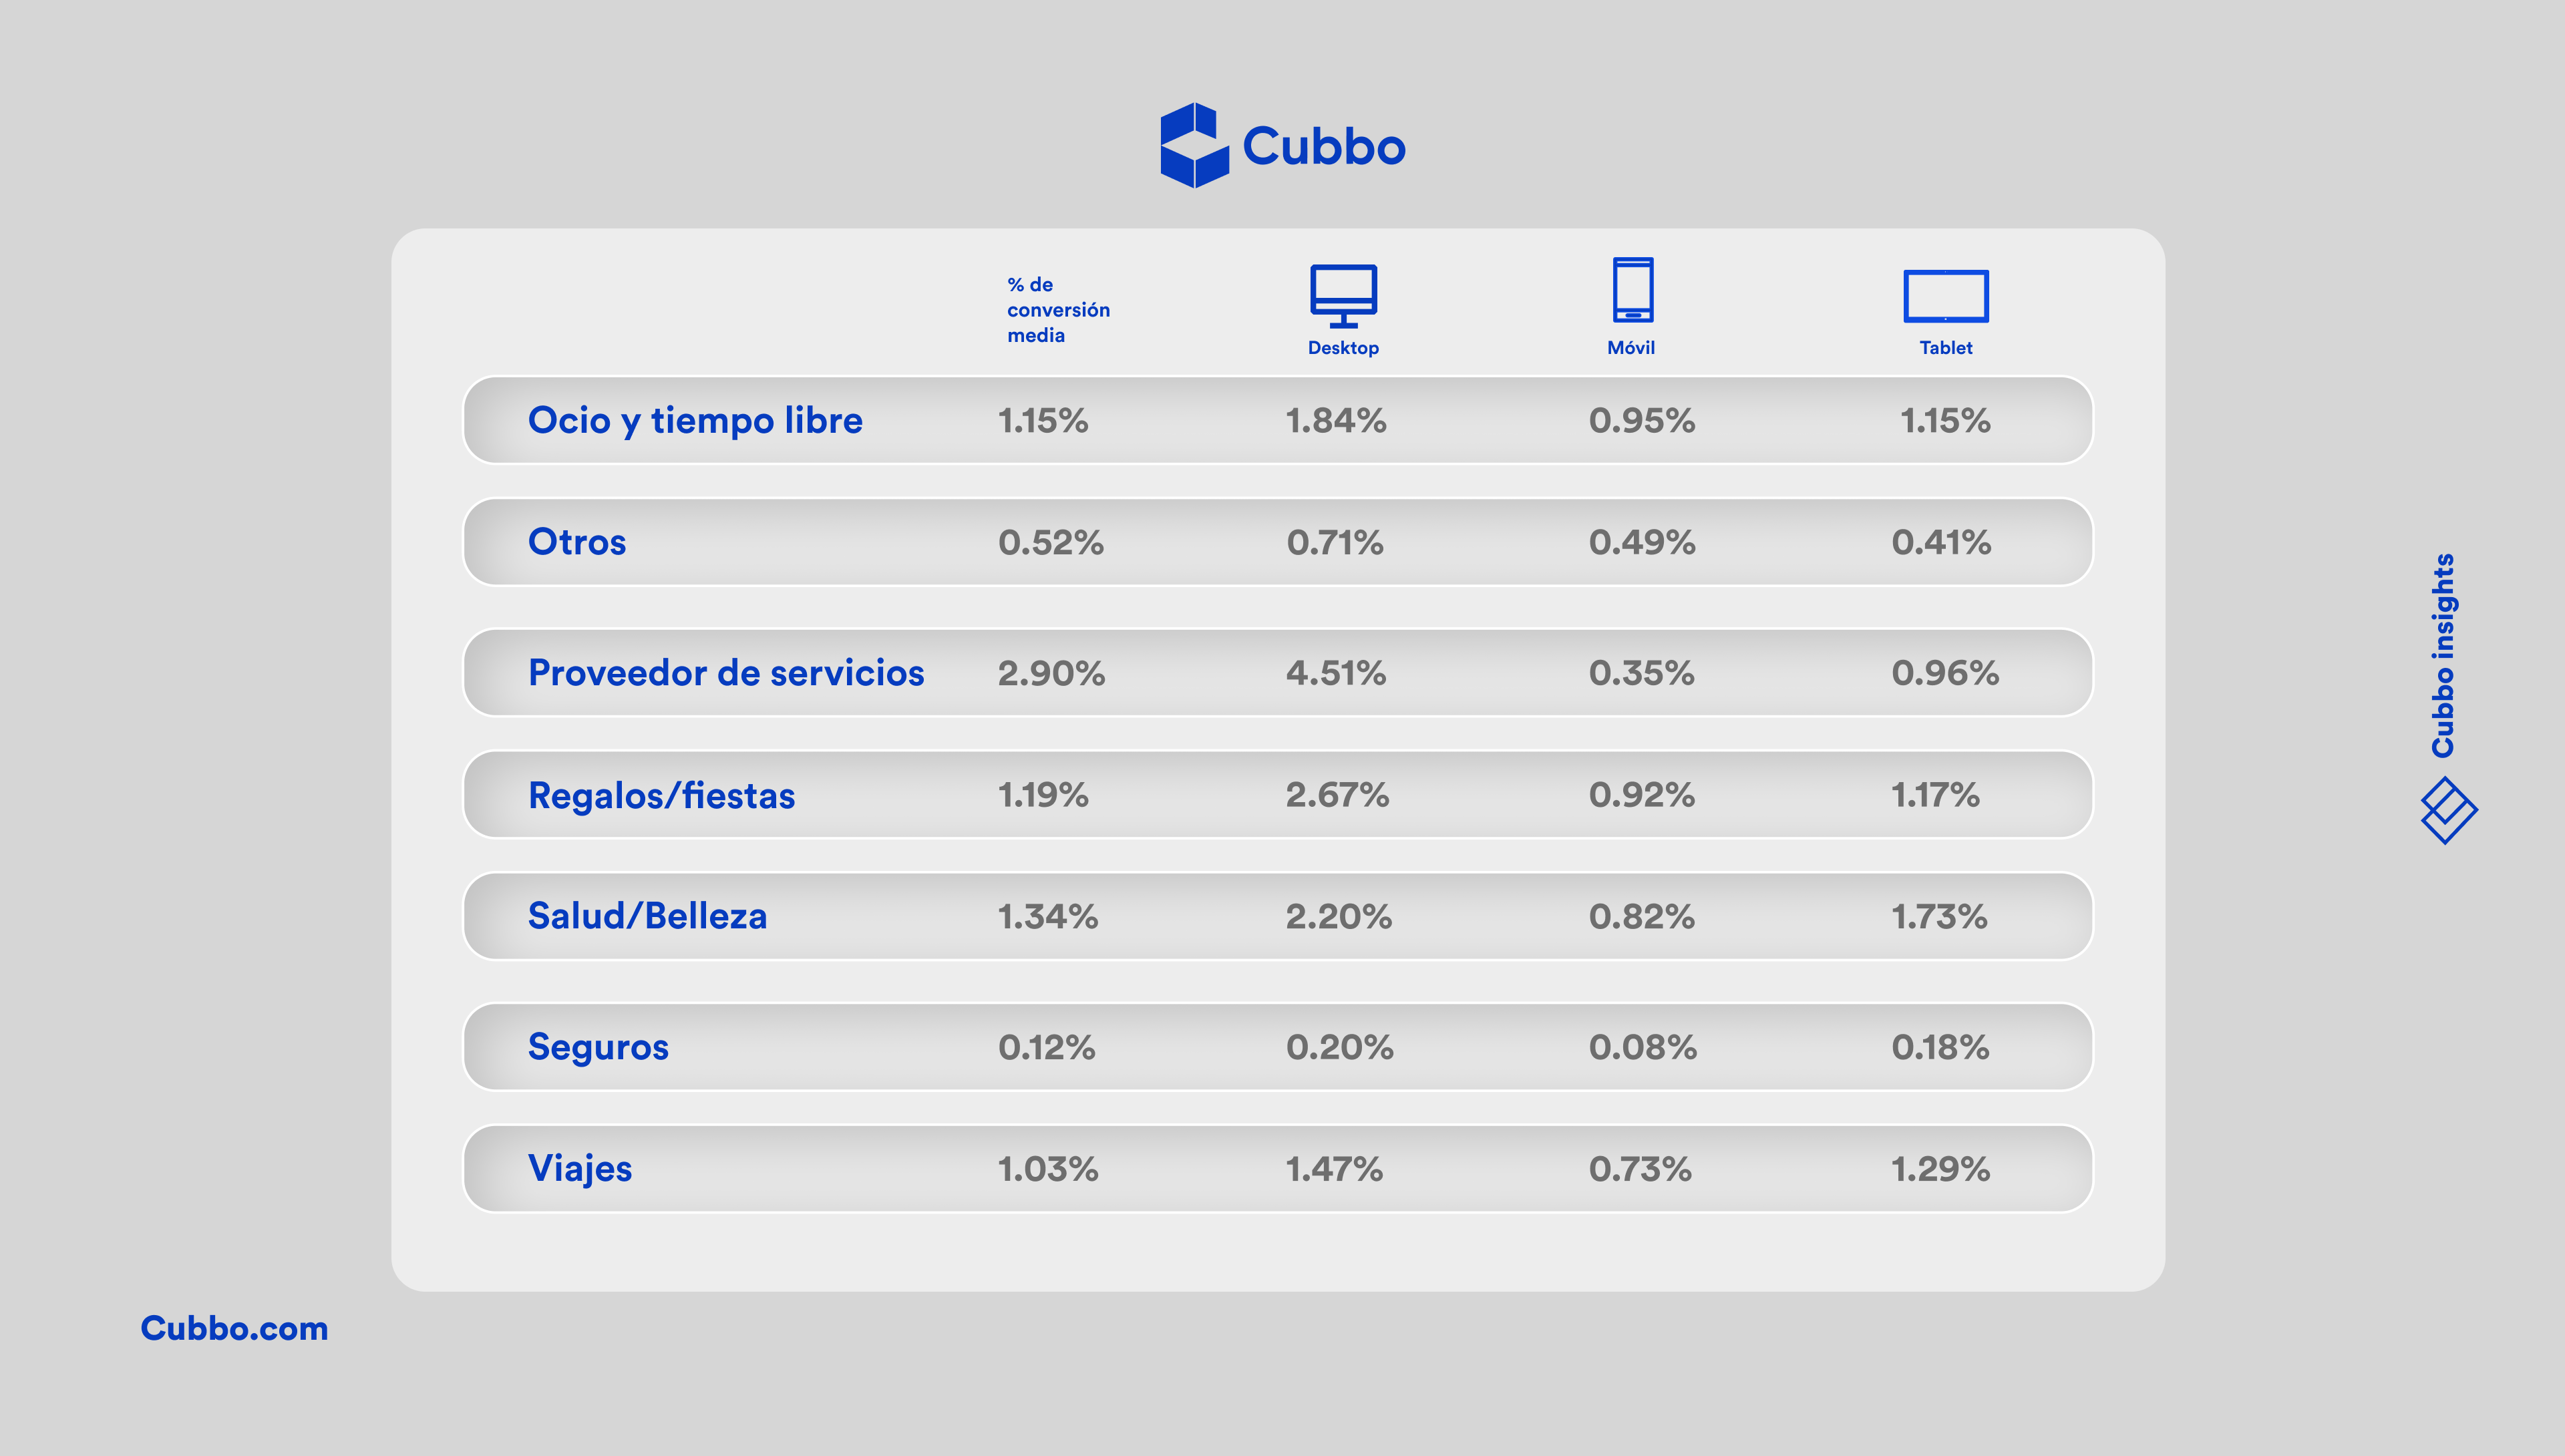
How much do you plan to sell? As you can see, you need to generate a lot of traffic to yourecommerceto achieve a certain level of sales. If you don't know how to do it, download our guide:Generate traffic to your ecommerce in 5 easy steps.
How to improve this indicator?
The ideal is to increase or keep your conversion rate stable. To do so, in addition to generating traffic, which, as we have already seen, is essential, keep the following 5 tips in mind:
- Be different, offer added values to the customer that the competition does not provide.
- Transmit confidence, include positive testimonials from your buyers in the store.
- Provide a pleasant and comfortable browsing experience (evaluate your UX).
- Post clear, concise product descriptions, along with images, payment method information, and promotions.
- Consider an easy and intuitive purchasing process, the fewer clicks the better.
Smooth and reliable navigation also depends on the quality of shipping. Have alogistics company in MexicoThat guarantees timely and traceable deliveries can improve conversion by reducing customer uncertainty during the purchasing process.

2. Customer Acquisition Cost (CAC)
Every time we develop a strategy, we must think about the objectives we want to achieve and the investment we require to make it a reality.
Social networks and Google, for example, allow you to advertise on their platforms to publicize your products and generate visits to your store. To do this, you must allocate a budget and at the end of the campaign, determine how much it cost you to acquire each customer; This is where this indicator will be very useful to you.
To calculate yourCACSimply divide the total value invested in advertising by the number of visitors who made the conversion you expected.
Example: If you invested $500 pesos in campaigns that generated 15 clients, yourCACIt is approximately $33 pesos.

This way you will know how much it costs you to acquire each client and make an investment projection, according to the number of clients you want to attract. Optimize delivery with alogistics company in Mexico Citycan help you reduce CAC by improving the post-purchase experience and encouraging repurchases without increasing ad spend.
The following are other KPIs related to conversion and return on investment that will also be useful to you:
ROI (Return on Investment)
How much did you win or lose?ecommercefor the activities developed? ROI is an indicator that allows you to measure the return on investment of your advanced actions. To calculate it and determine whether a strategy was profitable or not, use the following formula:
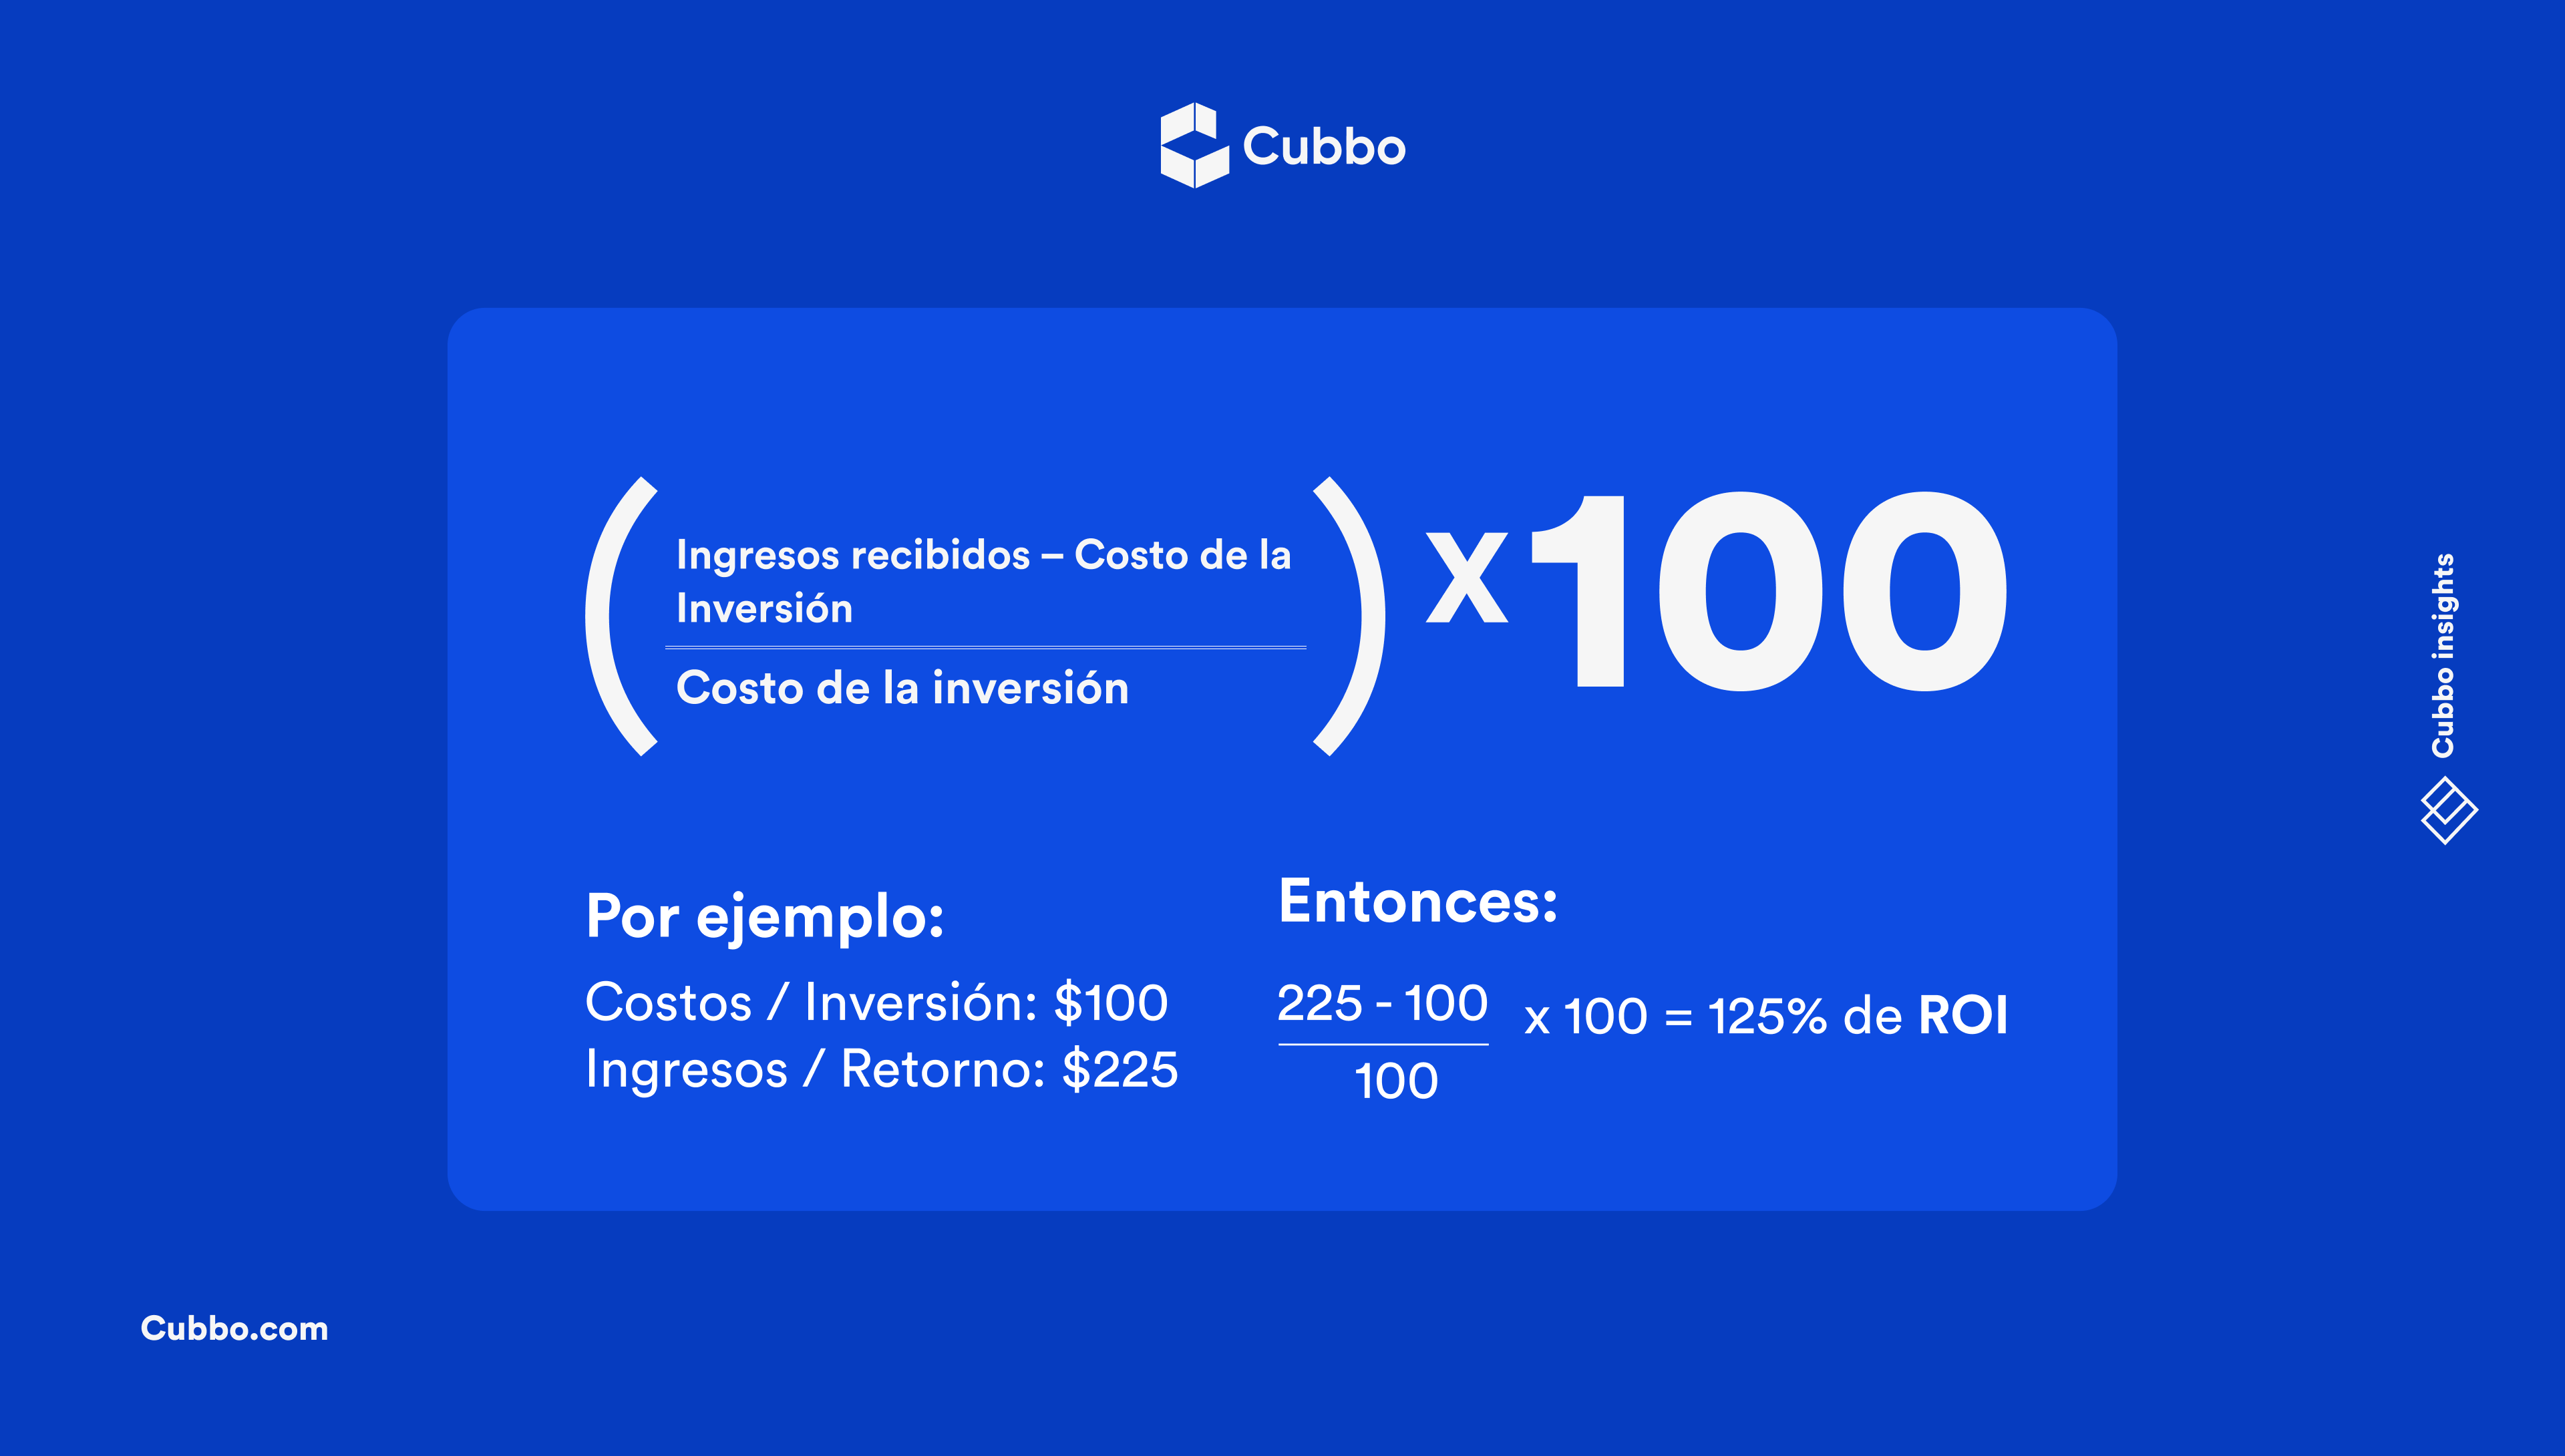
For this case, theecommerceHe invested $100 pesos in the purchase of the product, the execution of an advertising campaign on social networks and other associated expenses. Through this strategy, he obtained sales of $225 pesos. This means that their return on investment was 125%.
Measure how much each of the advanced actions generate for you, define the most profitable channels and enhance your strategies in them. Measure your ROI and make smart investments.
Cart abandonment rate
In case you didn't know, more than 70% of purchases that start in aecommerce, end up in abandoned carts. Quite a discouraging figure, right? More so, if we think about its contribution to our sales objectives. But why does this situation arise? How do you know what your current rate is and how to reduce it? Let's see:
According to Statista studies, among the main causes that consumers attribute for abandoning the purchase are:
- Shipping costs or taxes too high.
- Account creation requirement to complete the purchase.
- Payment process that is too long or complicated, does not indicate the stages of the process, requires many clicks, additional steps, is not clear or distracting.
- Very extended delivery time.
- Lack of trust in the site to provide credit card details.
- Few payment alternatives.
You already know the reasons that may cause your customers to leave abandoned carts, evaluate how yourecommerceface each aspect and undertake improvement actions, only then will you be able to reduce this indicator within your store.
In Google Analytics you can configure and track your conversion funnel, showing in which phases of the process the majority of abandonments are occurring, information that will be very useful for rethinking your sales strategies.
In addition to the above, a good option to encourage conversion is to send a reminder email to the customer, indicating that they have not completed their purchase; lack of time or being distracted by another matter may have caused the customer to leave.ecommerce. The ideal, in this case, is for it to be sent within the hour after abandoning the cart, this time range has shown the best results, according to studies on the subject.
After-sales service andcustomer serviceThey also directly influence the acquisition cost. Efficient support not only drives repurchases, but also reduces acquisition costs derived from dissatisfied customers.
What is your current status?
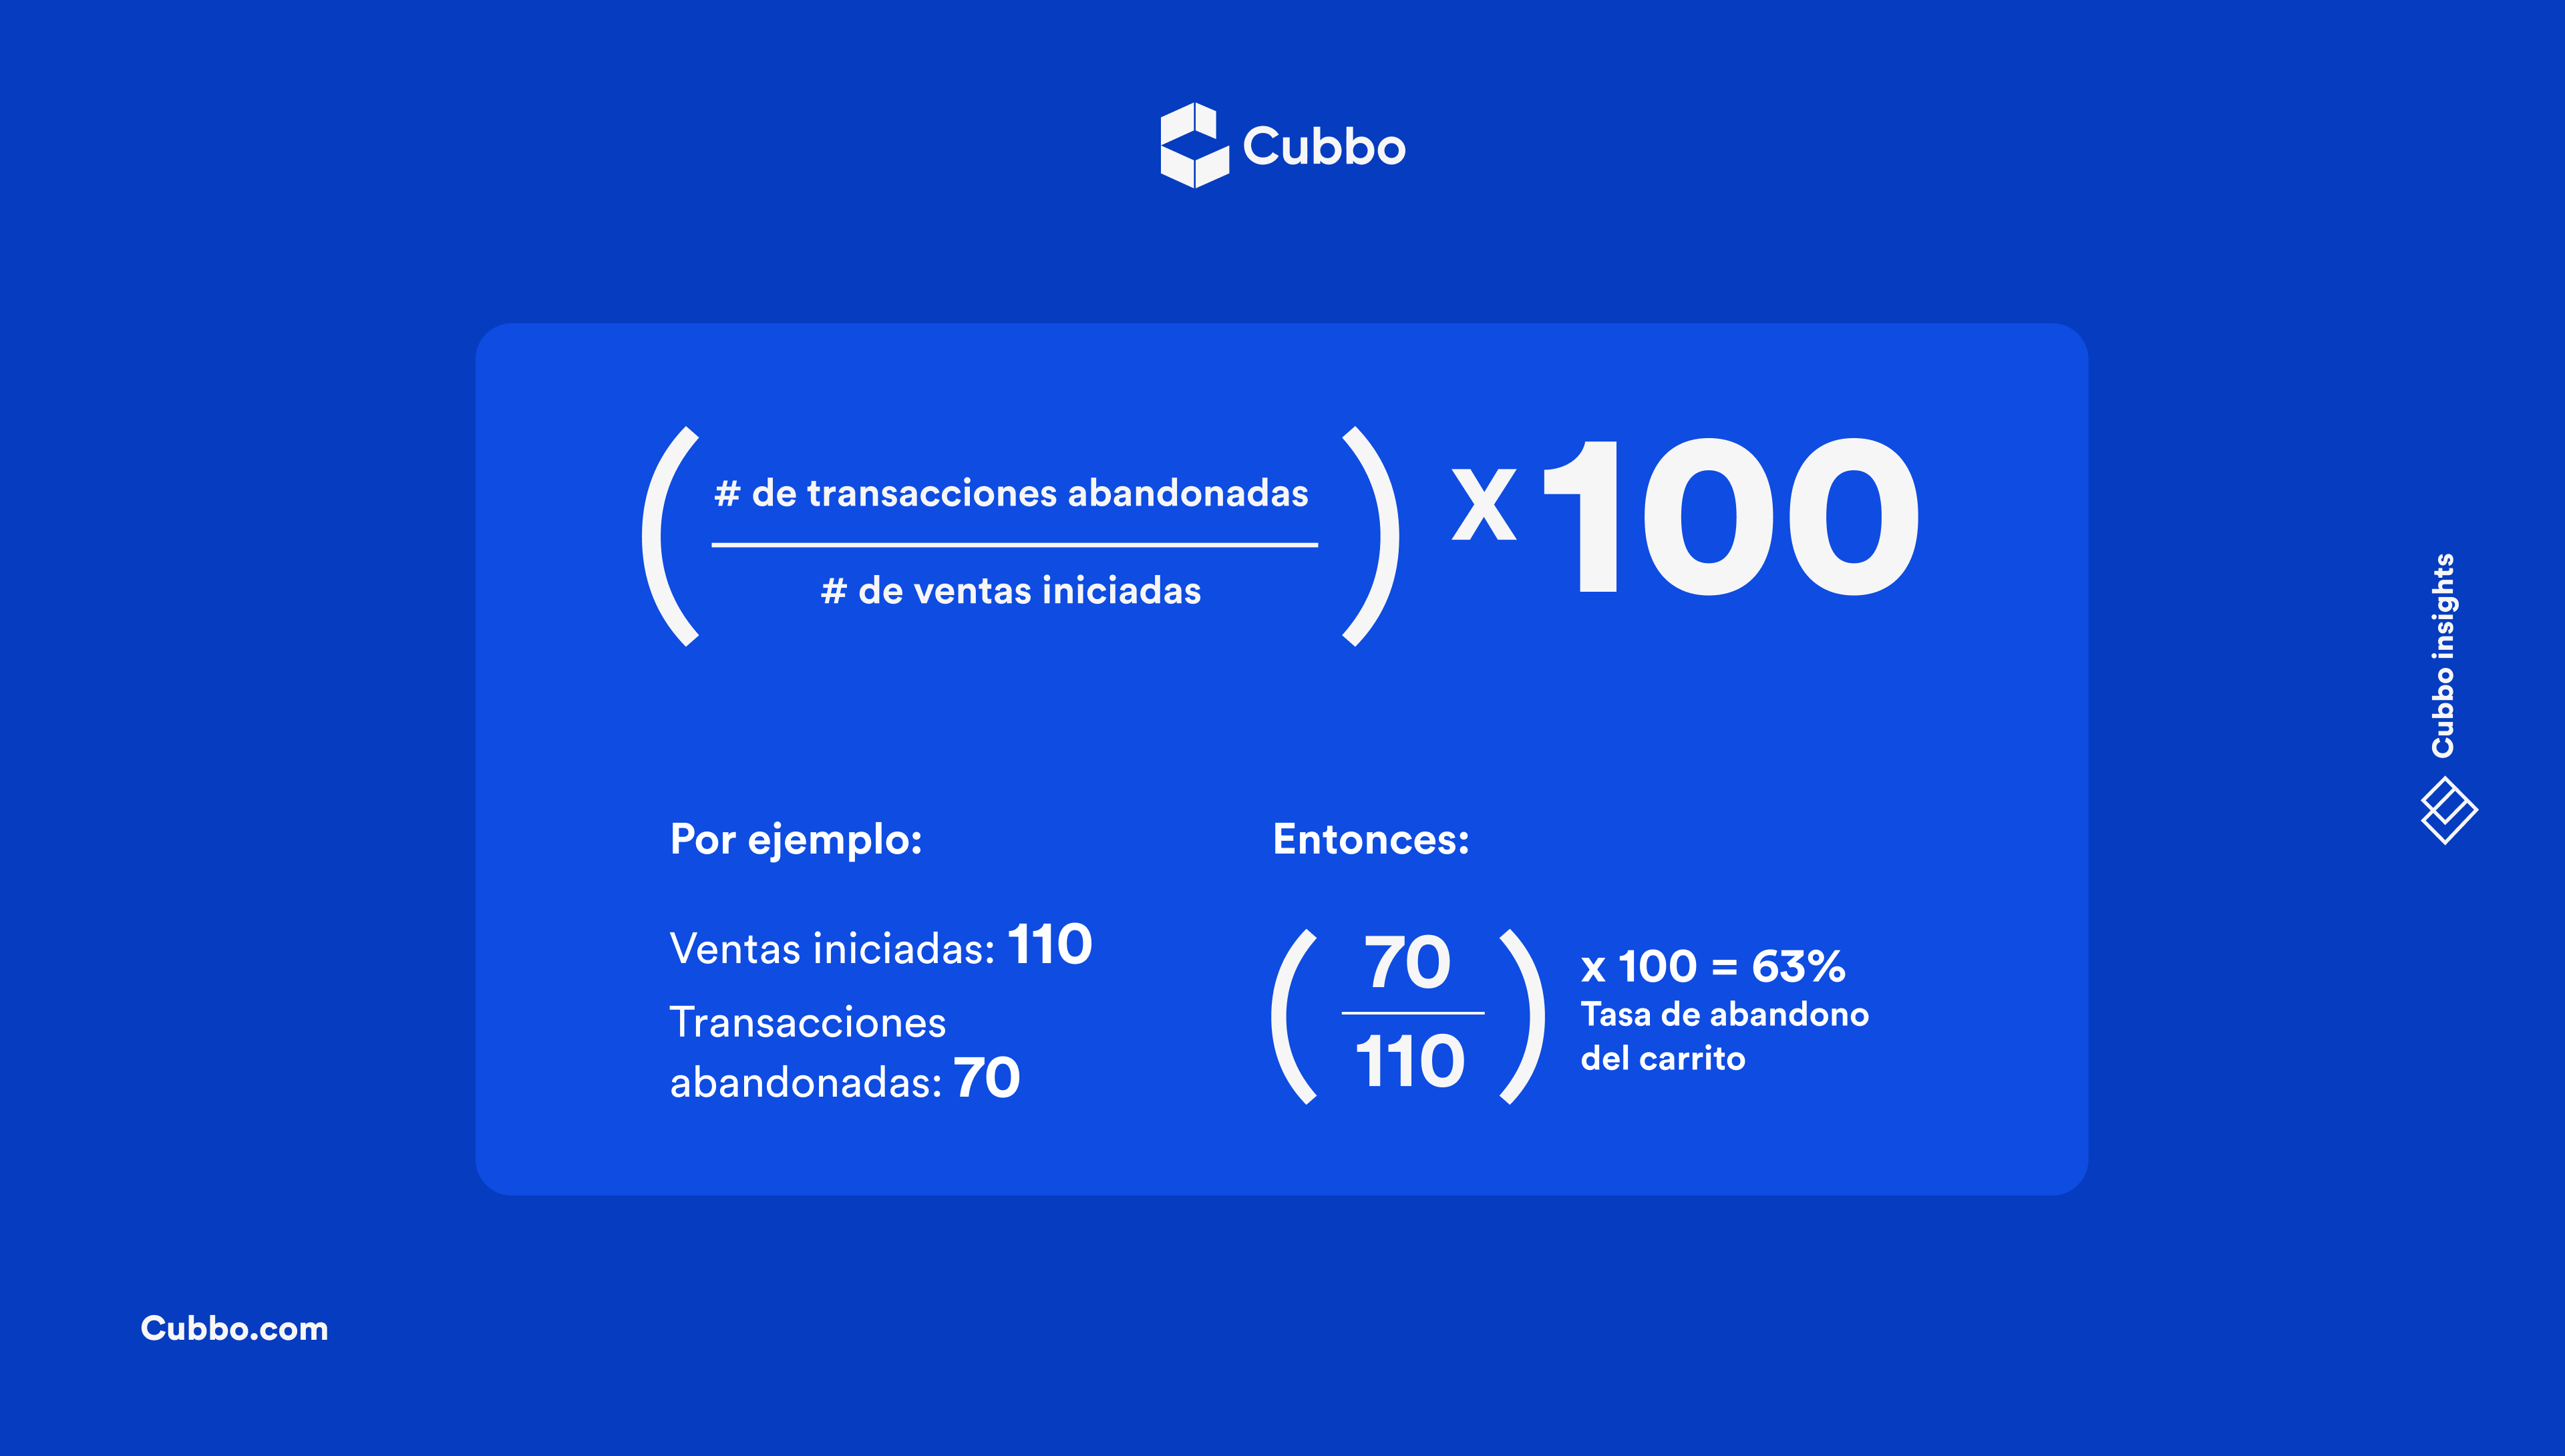
Calculating your abandonment rate is simple, just do the following division:
3.Customer Retention Rate (CRR)/Repurchase
This indicator can tell you a lot about your online store, the service you offer and the level of loyalty of your customers. A high rate will speak highly of your brand and will be reflected in a greater number of repurchases, which is highly profitable for your business; Acquiring a new customer costs 5 times more than retaining one.
You can analyze month by month, how many of your customers were recurring and how many were new, this will allow you to determine your retention rate. ACRTlow, it may indicate dissatisfied customers, investigate their purchasing experience and consider their comments as opportunities for improvement. On the other hand, aCRThigh, it reflects loyal customers who not only buy from you again, but also help promote your product and attract more customers.
Measure satisfaction throughcustomer experienceallows you to identify friction points that affect repurchase. A customer who has a fluid and consistent experience with each purchase is more likely to become an ambassador for your brand.
To calculate your recurring customer rate, you must define a measurement period, for this example we will take the month of August ofecommerceZ, and consider the following aspects:
- # of recurring customers (200)
- # of total clients at the end of August (600)

Ideally, your retention rate would be 100%, however, it is a fairly ambitious figure. Whatever your current rate is, focus on improving it more every day. Next, we will teach you how to do it.
How to improve this indicator?
Take the consumer experience beyond the purchasing process, ensuring that every interaction they have with yourecommercebecomes a moment of satisfaction, this will help improve your retention rate and increase the customer life cycle. A greater number of sales translates into better income for your store.
Have the support of alogistics company in MexicoHelps maintain consistent, fast and error-free deliveries, strengthening your customer loyalty.
Keep these tips in mind:
- Request feedback on your product and service, read reviews and comments left by customers, conduct surveys.
- Improve your customer service, humanize your brand and make the buyer feel close to you, allow them to have direct contact with an area that listens to them, resolves their doubts and needs in a timely manner.
- Offer different benefits to your customers, they will perceive them as added value and will stay with your brand.
4. Inventory Rotation
This KPI allows you to measure the number of times you renew your inventory in a given time, a useful aspect to consider aspects such as the number of times the inventory needs to be supplied to avoid out of stock products, the greater the amount of rotation, the higher the sales level of theecommerce.
How to measure your turnover?
To find out your level of inventory turnover, add up all the products sold in a certain period, and divide this amount by the number of products available in inventory throughout the same period. SomeecommerceThey calculate their turnover by weeks (WOS), others, by months (MOS). For example:
Aecommercesells brand 123 depigmenting sunscreen, at the beginning of the month it has 50 units in its inventory, during the first week it sells 25, to replace them, theecommercebuy another 25, and in the following weeks of the month, repeat this process 3 times, resulting in 100 protectors sold and 50 in inventory.
If the total number of protectors sold is added = 100 and divided by the average inventory held during the month = 50, the inventory turnover will be equal to 2.

Inventory turnover should not be so high that it affects the availability of products, nor so low that it means having products stored for a long time, due to lack of sales.
This last point is quite important, because depending on the rotation times that each industry manages (it is not the same in aecommerceof cars than one of shoes), a product that remains in the warehouse for a long time means losses, so that this does not happen, your inventory rotation must be greater than 1.
Efficient inventory management is not only measured in numbers, it also depends on having logistical processes that ensure availability and speed of delivery.
This is where ashipping platform in Mexicomakes a difference, helping e-commerce stores maintain real-time control over stock and distribution, avoiding inventory shortages and improving the customer experience. If you operate from the capital, ashipping platform in Mexico CityIt allows you to optimize times and offer same-day deliveries in the main urban areas.
5. Average Order Value (AOV)
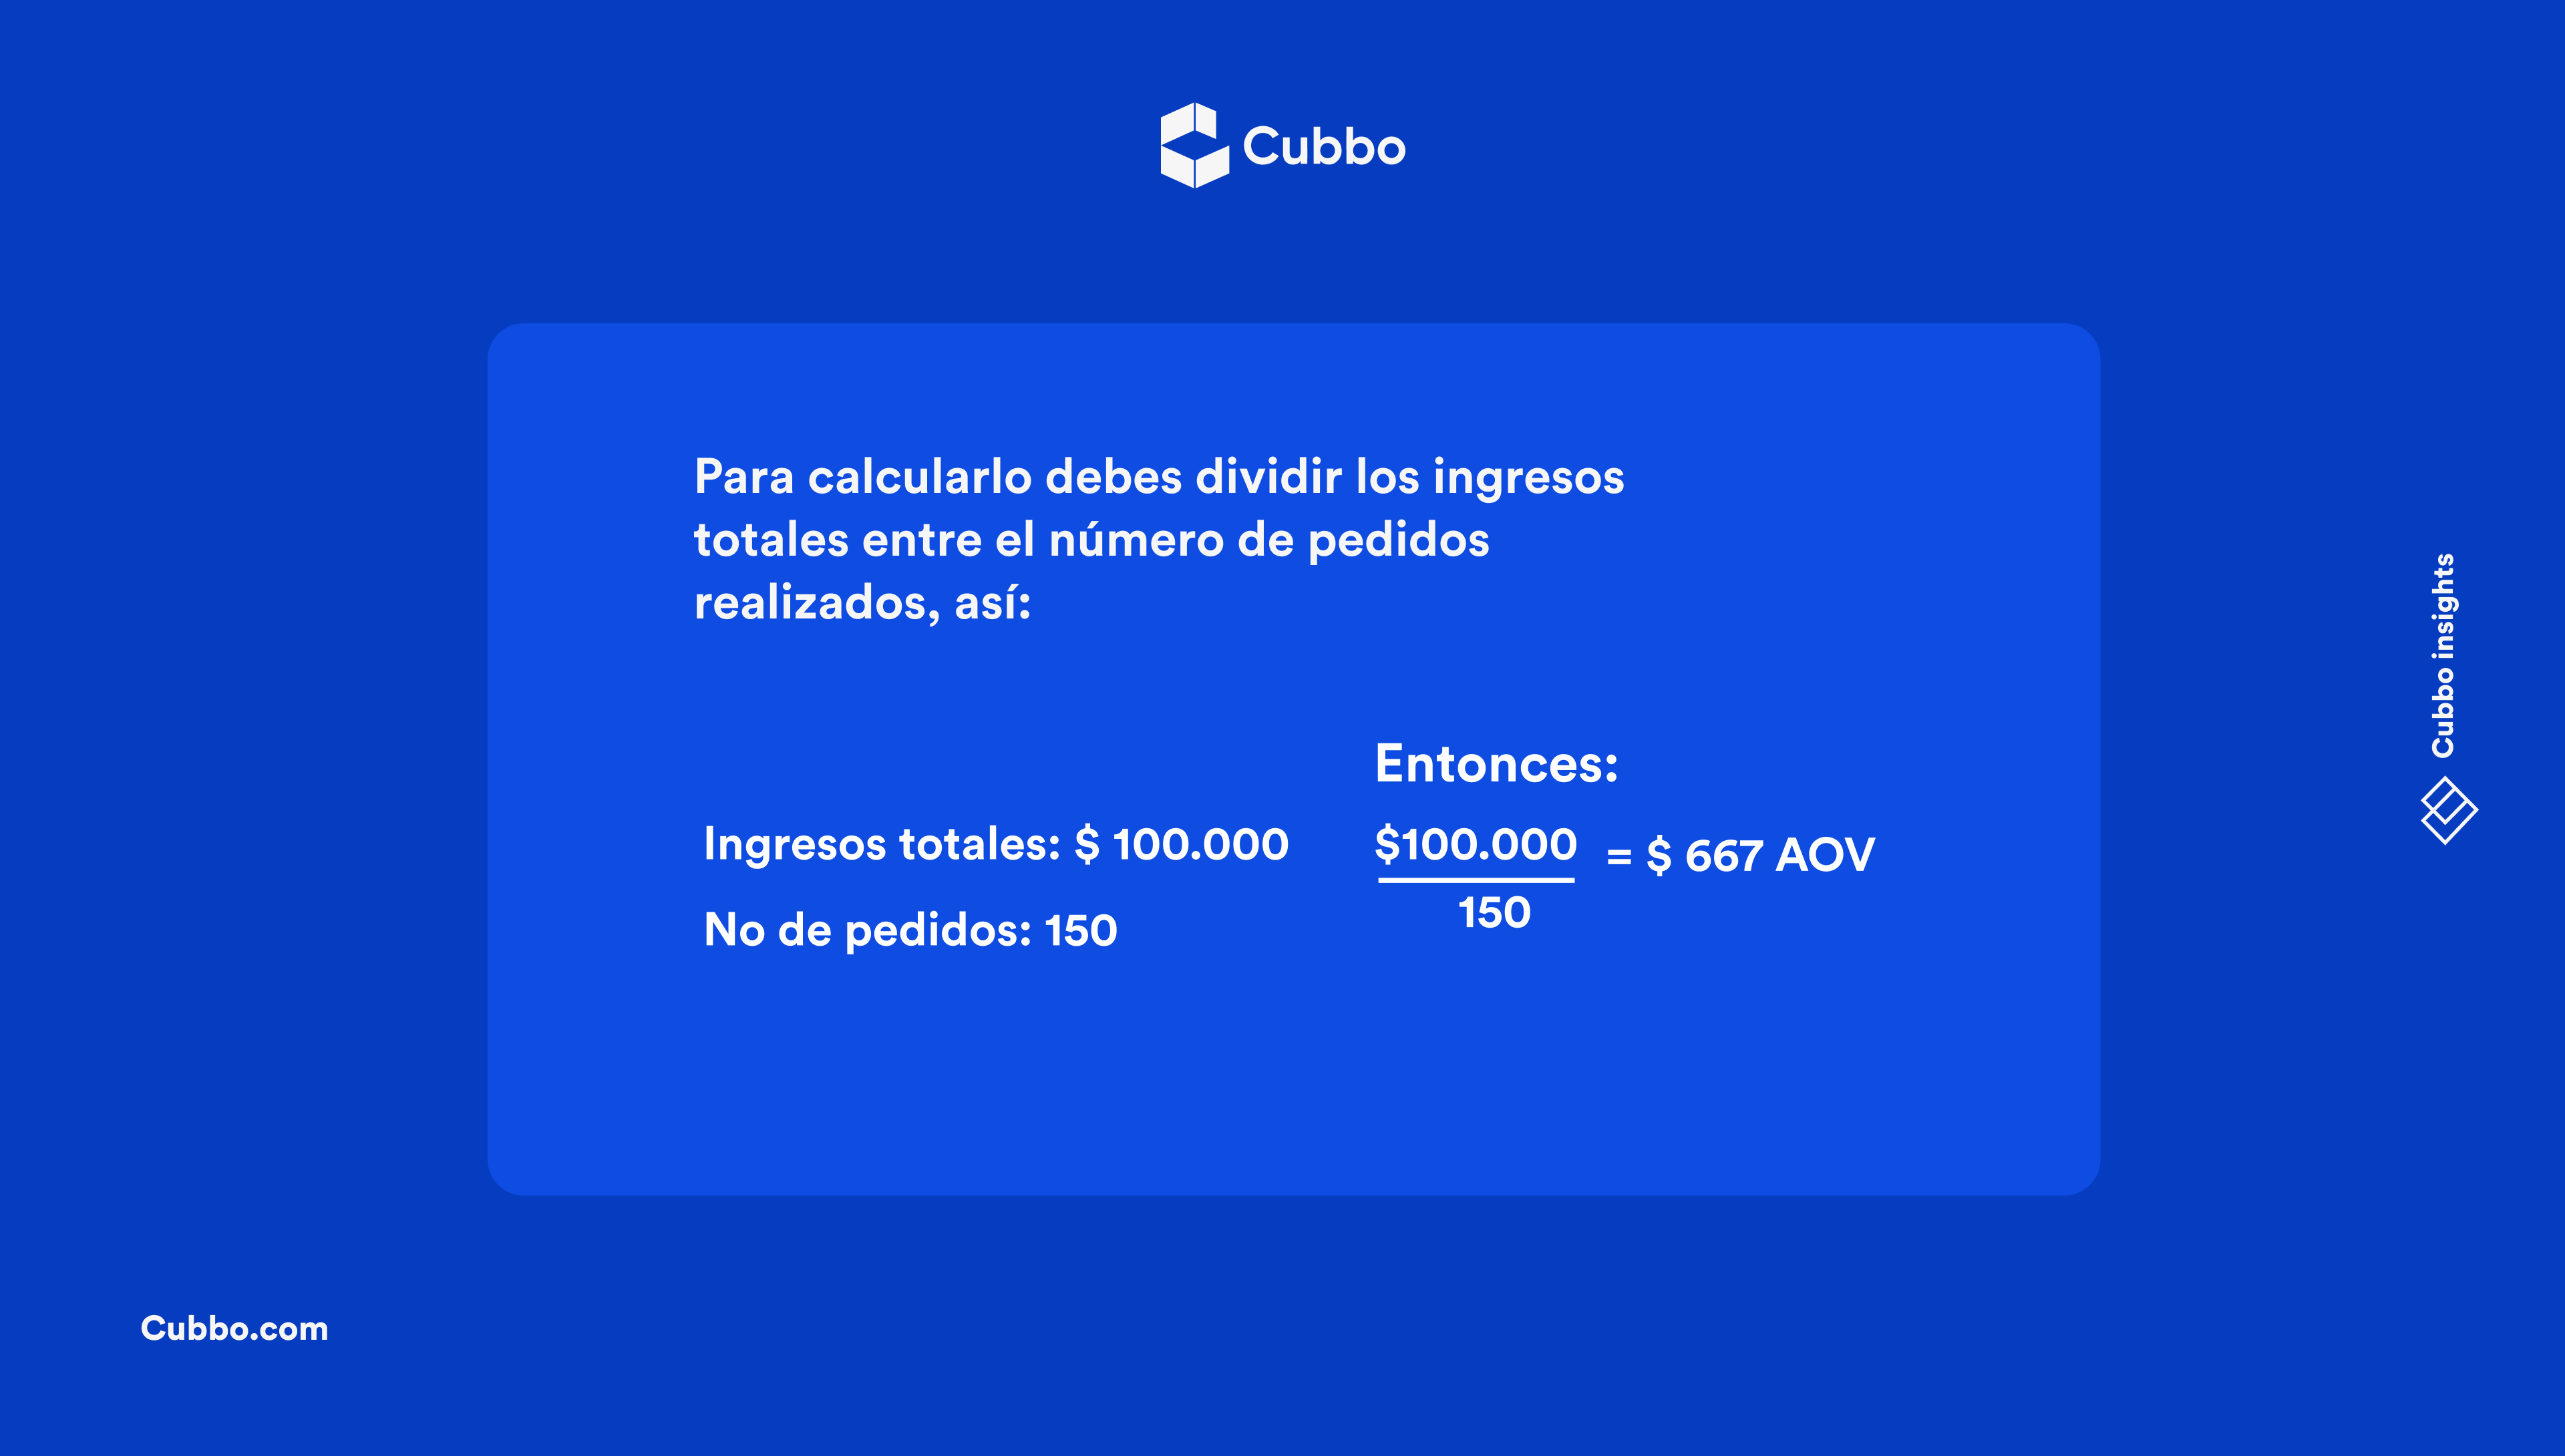
Average order value. It is the amount of money your customers spend when they make a purchase on yourecommerce. This indicator allows you to know the purchasing behavior of your buyers and evaluate how it impacts your profitability; If your AOV increases, your profit level will also increase; If you have more purchases in one order, it will be more profitable for yourecommerce.
6. Customer Lifetime Value (LTV)
Customer lifetime value. It refers to the total income that a client will generate for yourecommerceduring its “useful life” (during the time of relationship with your brand). This indicator is especially useful for growing businesses.
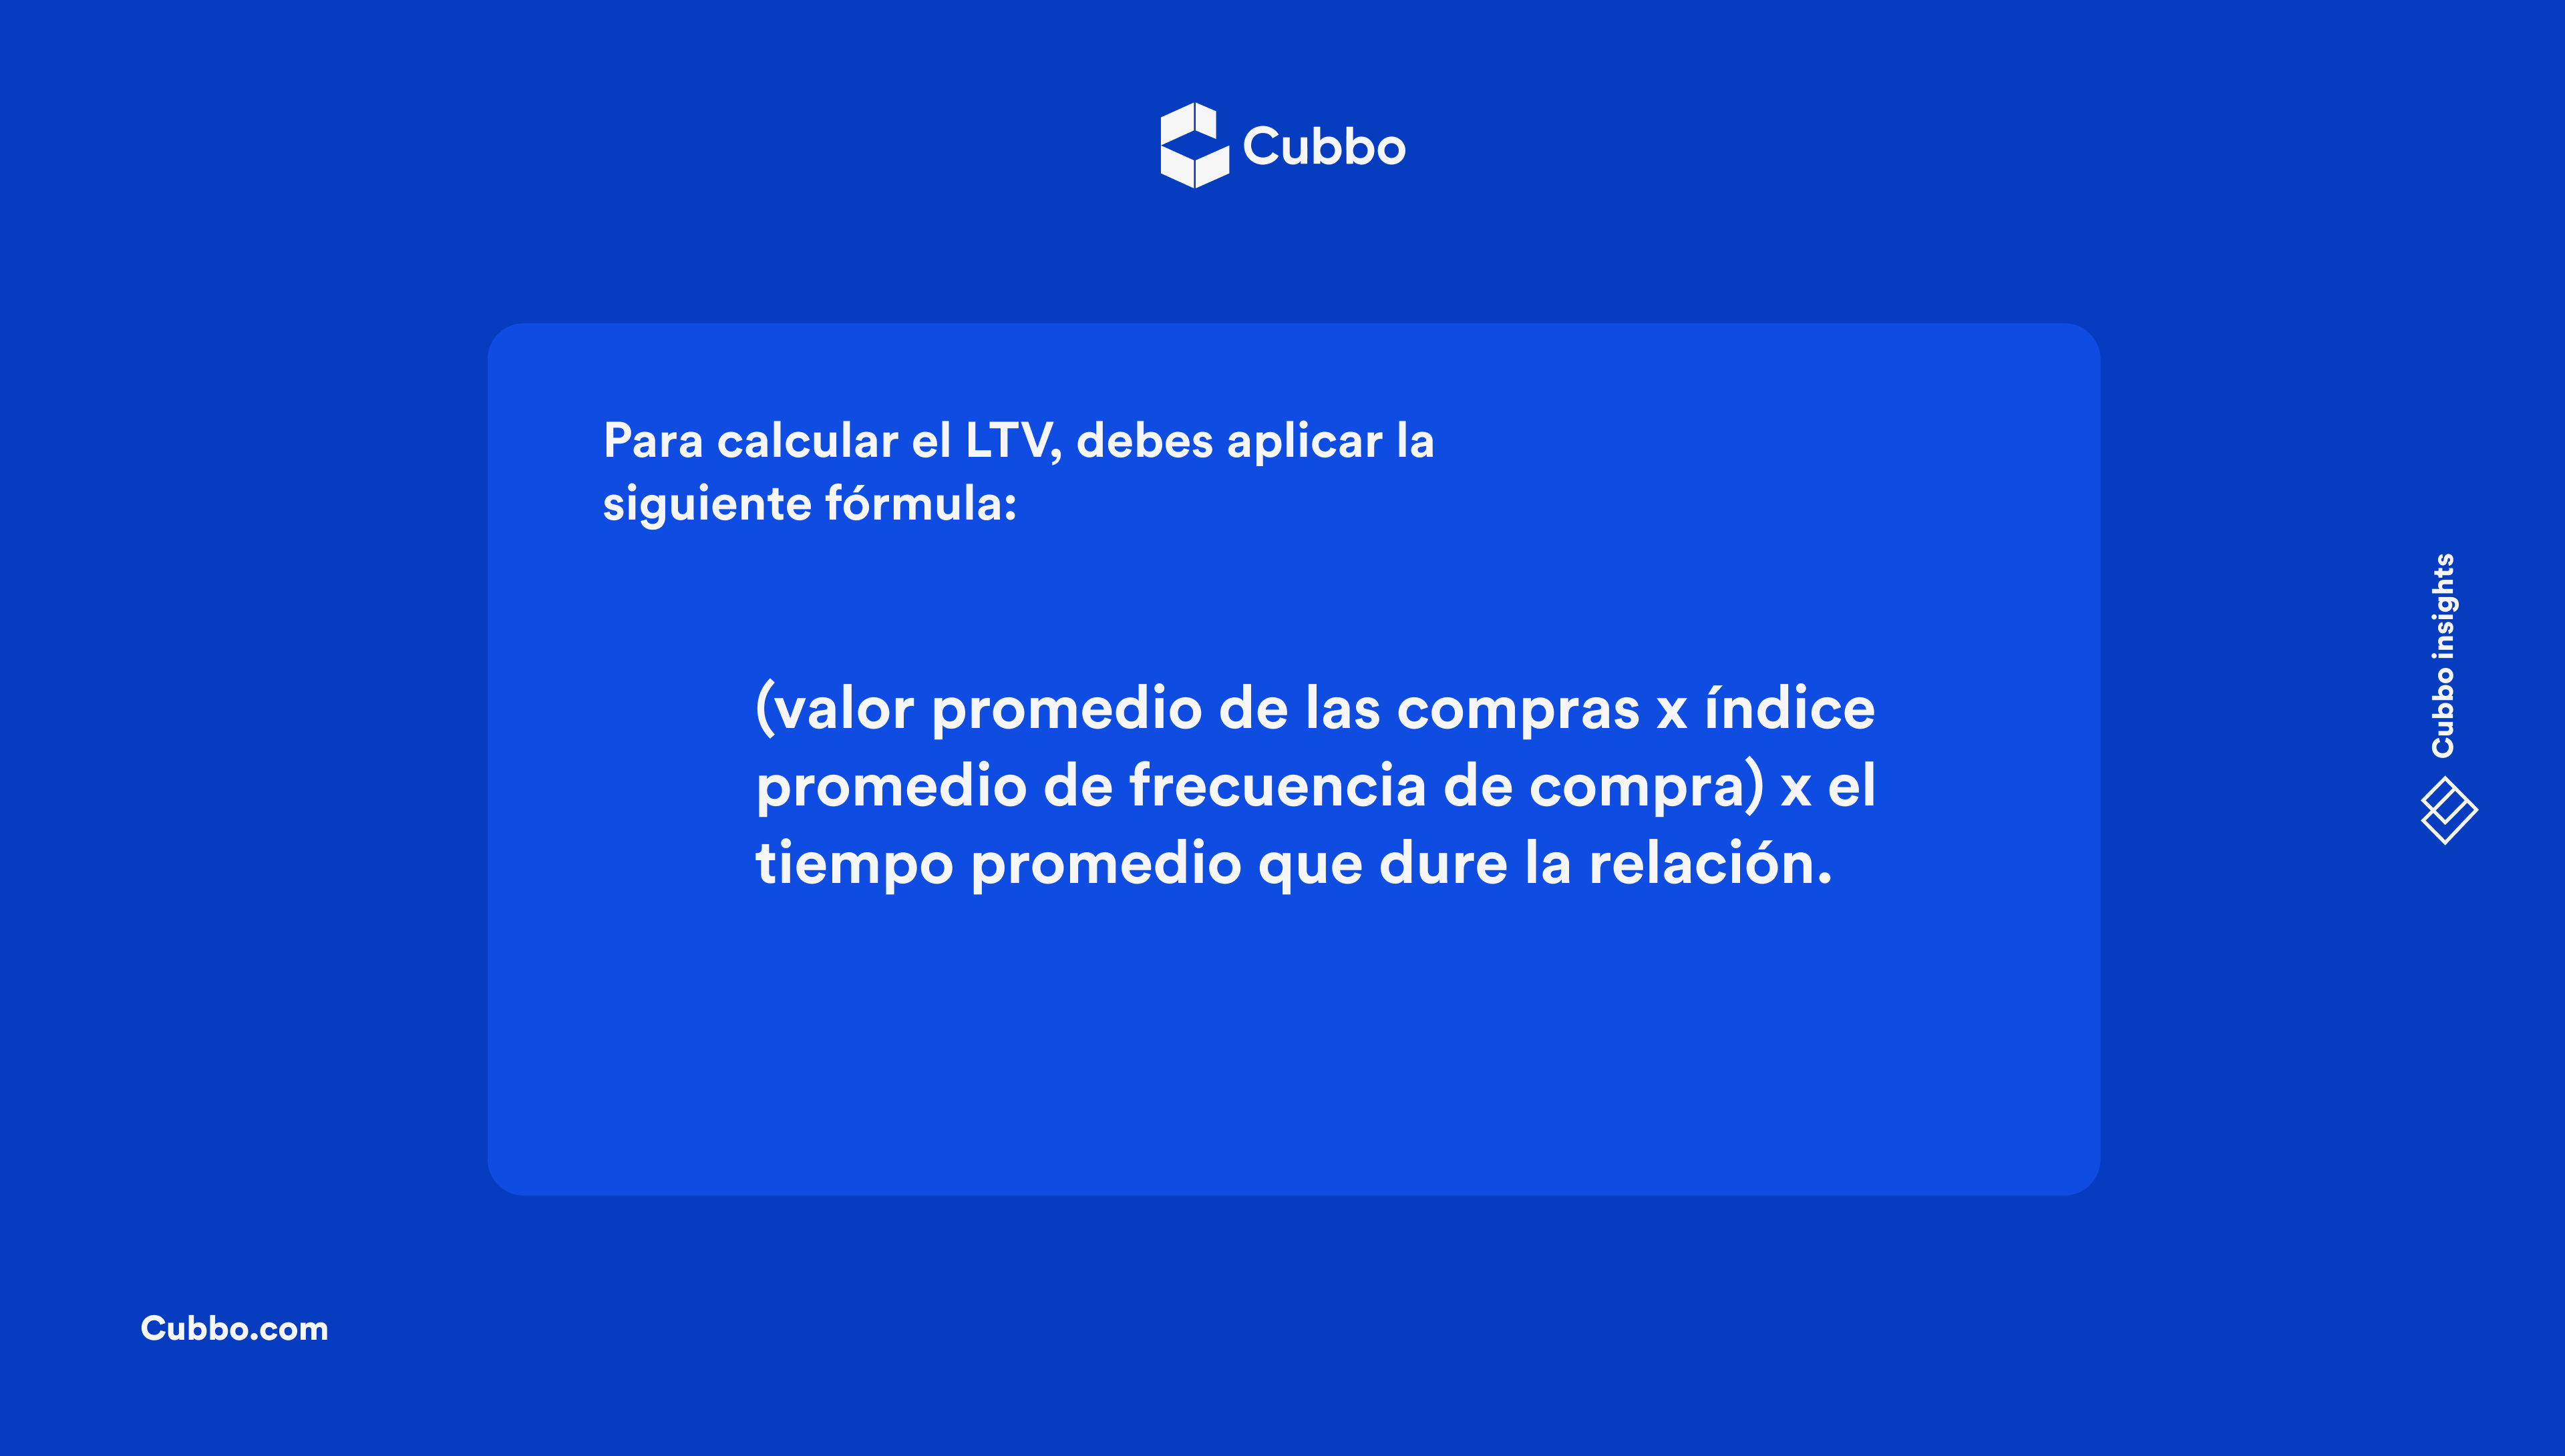
If you don't know how to obtain this data, we show you below:
Determine the average value of your ecommerce purchases. Consider the following example: Customer A spends an average of $500 pesos per month on purchases in your store, while customer B makes purchases on average of $800 pesos per month.
If we add the average purchase of both clients ($1,300 pesos) and divide it by 2, which is our number of sample clients, we have the average monthly purchase value of yourecommerceIt is $650 pesos.
Calculate the average purchase frequency index.How many purchases made by the customerecommerceper month. For our example, customer A makes 4 purchases, while customer B buys from your store 2 times a month. If we add the number of purchases by each customer (6) and divide it by 2, we find that the average purchase frequency index is 3.
Average length of time the relationship with the client lasts.How long on average do customers stay shopping at your store?ecommerce? For this example, we are going to look at 2 years.
Now you know how much the customer's average spending per month is and how many times they buy in your store during this period, we are going to calculate the LTV, taking into account the previous data:

Important:Contrasting your LTV with your customer acquisition cost (CAC) will allow you to determine the financial health of your business.ecommerceNever, the value of attracting a customer can be higher than the value of the income it will generate during its useful life.
To maintain a healthy LTV, speed of delivery and shipping reliability are key factors. Ashipping platform in Mexicocan help you reduce returns and increase customer satisfaction, boosting long-term loyalty.
Having a higher LTV allows customersecommercesave on the expenses incurred in attracting new customers. Focus on improving your retention strategies so that your LTV grows.
From measuring to improving: how to transform your KPIs into real growth for your ecommerce
Measuring is just the first step.
The true value of KPIs comes when you achieveturn data into decisionsand the decisions inmeasurable actions.
Many e-commerce companies record their monthly metrics, but fewthey interpret the story those metrics are telling: which customers are growing, where conversions are being lost, which products generate the most repurchases or which part of the operation is affecting your profitability.
In this section we explain howconnect the six key indicatorsfrom the original post—conversion rate, CAC, retention, churn, AOV, and LTV—to build a continuous improvement system that drives your profitability and operational efficiency.
1. See the complete system: KPIs do not live in isolation
One of the most common mistakes in ecommerce is analyzing each indicator separately.
For example: a goodconversion ratecan hide aelevated CAC; ahigh AOVmay be accompanied by aslow inventory turnover.
In practice,all KPIs are connected, and understanding their relationships allows you to see your business as a living system:
- Conversion and CAC→ If your conversion rate increases without increasing advertising investment, your CAC automatically decreases.
- Retention and LTV→ Each customer who repurchases increases the lifetime value (LTV), reducing the need for constant investment in new customers.
- AOV and profitability→ Increasing the average value per order improves your margin, even if your sales volume remains stable.
- Rotation and logistical compliance→ Efficiently rotating inventory frees up capital and improves cash flow.
💡 Tip:Establish a panel where you view the six KPIs together, with a weekly or monthly trend. Don't just look for numbers: lookrelationships between numbers.
2. From measurement to diagnosis: identifying the causes behind the data
Indicators are not an end in themselves; They are a compass that shows youwhere to look and what to correct.
When you detect negative variations, ask yourself:
- What changed in my marketing strategies?
- Were there stock shortages or logistical delays?
- Did I modify prices, promotions or delivery times?
- Was my site updated or were there technical glitches that affected conversions?
For example:
- If youconversion ratefalls, check theloading speed, thepayment methodsand theshipping costs visible at checkout.
- If youinventory rotationlow, analyze if you are accumulating references with little demand or if your shipments are taking longer than usual.
- If youLTVdecreases, you are probably losing buybacks due to lack of post-sales communication or unreliable deliveries.
Every metric tells a story. Your job isinterpret it before reacting.
3. Also measure the operation: the invisible KPI of fulfillment
Many ecommerce companies measure their commercial metrics (sales, conversion, retention), butthey neglect operational indicators, which are what sustain the customer experience.
A professional fulfillment system—like the one atCubbo— allows youquantify internal efficiencythrough key indicators:
- Average order preparation time (picking & packing).
- Inventory Accuracy:percentage of products correctly registered vs. real.
- Delivery compliance rate (on-time delivery).
- Rate of logistics returns or shipping errors.
These operational KPIs have a direct impact on your commercial KPIs.
Precise operation reduces abandoned carts, improves repurchases and increases overall satisfaction.
💡 Example:
If your logistics compliance goes from 92% to 99%, your retention rate can grow up to 15% in a few months, according to studies by Zendesk and Shopify.
4. How to automate the measurement of KPIs
Measuring manually is possible, but not sustainable.
The key is inautomate data capture and visualizationso your team can focus on analyzing and acting.
Tools like Google Analytics, Data Studio, HubSpot or Shopify's native dashboards allow you to link your traffic sources, orders and conversions.
However, few systems integrate thelogistics side of ecommerce.
This is where platforms withtechnological fulfillment, like Cubbo, make a difference: their systems connect directly to your ecommerce and show real-time metrics such as:
- Orders processed per day.
- Inventory accuracy.
- Stock level by SKU.
- On-time deliveries vs. delayed.
- Average time from purchase to delivery.
This allows marketing metrics to be crossed with operational metrics, obtaining a complete view of performance.
5. KPI + action: how to go from analysis to improvement
Measuring without acting does not change results.
Therefore, each KPI must have aassociated action plan.
Let's look at practical examples:
▪️ If your conversion rate is low:
- Simplify the payment process.
- Add fast and visible shipping methods from the start.
- Improve the visual quality of your products.
▪️ If your CAC is high:
- Optimize ad targeting.
- Boost organic recruitment with SEO and email marketing.
- Implement referral or rewards programs.
▪️ If your retention is low:
- Improve the after-sales experience.
- Offer faster shipping or exclusive benefits.
- Automate follow-up and thank you emails.
▪️ If your rotation is slow:
- Make smart discounts on products with low sales.
- Adjust your purchase forecasts according to actual demand.
- Evaluate moving part of the stock to astrategic fulfillment center, closer to your clients.
💡 #CubboInsight:E-commerce companies that move inventory to urban centers such as CDMX reduce their average delivery time by up to 60%, which improves conversion and increases LTV.
6. The power of AOV and LTV for sustainability
Among all the indicators, theAOV (Average Order Value)and theLTV (Lifetime Value)They are the ones that determine thelong-term financial health.
- A high AOV improves your immediate profitability.
- A high LTV guarantees your future sustainability.
To optimize them:
▪️ Increase AOV:
- Offer packs or bundles with discounts.
- Apply cross-selling (“other customers also bought”).
- Implement free shipping over a certain amount.
▪️ Raise LTV:
- Design loyalty or membership programs.
- Take care of the speed and precision of your deliveries.
- Create educational content and exclusive after-sales promotions.
Remember:The customer who repurchases not only spends more, it also costs less.
Maintaining loyalty translates into a more stable and predictable growth curve.
7. Integrate your KPIs into the general business strategy
Measuring KPIs should not be an isolated task of the marketing team or the operations area.
It must become aorganizational culture: each area contributes and depends on the indicators to make decisions.
- Marketingmeasures CAC, ROI and conversion.
- Operationscontrols rotation, compliance and logistics costs.
- Customer servicemonitors retention and NPS (satisfaction).
- General managementevaluates AOV, LTV and overall profitability.
When all teams share the same data source, information silos are eliminated and decisions become more consistent.
💡 Implement a single control panel:Connect your sales, traffic, inventory and fulfillment data.
Shared visibility improves communication and accelerates the execution of improvements.
8. Intelligent Fulfillment: the invisible ally of your metrics
In a modern ecommerce,logistics is also measured.
Every delay, error or lack of stock directly impacts your conversion, retention and LTV KPIs.
Atechnological fulfillment center, like Cubbo, allows youmonitor logistics indicators in real timethat affect your business results:
- Inventory Accuracy:99.98% proven.
- Shipping Compliance:99.7% of orders delivered on time.
- Processing time:Orders ready for dispatch in less than 24 hours.
- Same-day deliveries in CDMX and 1.3 days average nationwide.
By integrating this data with your business KPIs, you get a complete view of the total efficiency of the business, from the purchase click to the final delivery.
9. KPI + technology + logistics: the formula for competitive ecommerce
Today's ecommerce no longer competes only for prices or products, but foraccuracy, speed and data.
Measuring without reliable logistics generates frustration.
Having logistics without measurement prevents optimization.
The winning formula combines three elements:
- Clear and constantly measured KPIs.
- Technology that automates and visualizes the results.
- Efficient fulfillment that supports the delivery promise.
Only then can you achieve an operationprofitable, scalable and customer-focused.
Conclusion: measuring is the beginning, improving is the path
Measuring your KPIs is not a monthly task, it is a daily habit.
Each indicator shows you a piece of the puzzle that defines the direction of your ecommerce.
- Analyze trends, not just values.
- Connect business and logistics metrics.
- Act on the data, don't just observe it.
With atechnological fulfillment like Cubbo, you can turn your data into real results: faster orders, happier customers, and evidence-based decisions.
Because in modern ecommerce,what is not measured is not controlled; but what is not improved does not grow.
Make measurement your best tool
As you may have noticed throughout the text, the measurement ofKPIsIt is not something complicated, nor a field only for mathematicians, allecommerceThey can do it and enhance their results.
When setting your growth objectives, make sure they are coherent, take into account and as a basis, the results of the measurement indicators from previous months and set credible and achievable goals.
Measure and control, only then can you make intelligent and informed decisions for yourecommerce!
Are you looking for an ally to help you improve your delivery process, enhance your compliance and the satisfaction of your customers? Do not hesitate to contact us, we are the bestfulfillmentecommerce center in Mexico and Colombia,you just have to clickhere.
Information sources: